حجم سوق التصوير الحراري، والمشاركة وتحليل الصناعة حسب النوع (المحمولة والثابتة/المثبتة)، حسب التكنولوجيا (المبردة، غير المبردة)، حسب المنتج (الكاميرا الحرارية، النطاقات الحرارية، الوحدة الحرارية)، حسب الطول الموجي (الأشعة تحت الحمراء القصيرة الموجة (SWIR)، الأشعة تحت الحمراء متوسطة الموجة (MWIR)))، حسب التطبيق (مراقبة الحدود، استهداف المركبات، C-UAS)، حسب الرأسي (الفضاء والدفاع، إنفاذ القانون، الرعاية الصحية، السيارات)، والتوقعات الإقليمية، 2024-2032
Fortune Business Insights نتبع عملية بحث منهجية ودقيقة وشفافة، مصممة لتقديم معلومات دقيقة وموثوقة. جمع البيانات الأولية هو الأساس المتين لمنهجيتنا، حيث نجري مقابلات معمقة مع أصحاب المصلحة الرئيسيين في الصناعة، والمديرين التنفيذيين، ومديري المنتجات، والموزعين، والجهات التنظيمية، والخبراء في هذا المجال. يتيح لنا هذا النهج رصد وجهات نظر آنية، واتجاهات الصناعة، والفرص الناشئة، والتحديات الخفية التي لا تزال غائبة عن المصادر العامة.
يتم تعزيز بحثنا الأساسي من خلال البيانات الواقعية التي تم جمعها من مصادر ثانوية موثوقة. بالإضافة إلى ذلك، تجمع عملية البحث المكتبي لدينا المعلومات من التقارير السنوية للشركة، ومنشورات جمعيات الصناعة، وقواعد البيانات الحكومية والتنظيمية، وقواعد البيانات التجارية المدفوعة مثل فاكتيفا، وبلومبرج، وستاتيستا. تساعد هذه النتائج في رسم خريطة لحجم القطاع، وديناميكيات المنافسة، والأنظمة التنظيمية، والاتجاهات التاريخية، والتي تُشكل جوهر نهجنا القائم على البيانات.
منهجية البحث - عملية البحث
تحديد الأهداف، النطاق، المنهجية، الجدول الزمني والمخرجات بوضوح
إجراء بحث ثانوي باستخدام مصادر عامة موثوقة وقواعد بيانات داخلية لجمع بيانات ذات صلة بأهداف البحث
التركيز على الدقة

يتم التحقق من جميع البيانات الرقمية من خلال النمذجة الخاصة بالشركة وتثليث البيانات، بالجمع بين المعلومات الأولية، البيانات الثانوية، والمناهج التصاعدية/التنازلية لضمان الدقة والاتساق.

اعتماد عملية بحث منهجية وشفافة مع التركيز على المقابلات الأولية مع خبراء الصناعة لتقديم رؤى دقيقة وفورية وكشف التحديات الخفية في السوق.

استخدام مصادر ثانوية موثوقة مثل تقارير الشركات، بيانات الجمعيات، وقواعد البيانات لبناء قاعدة بيانات قوية لدعم تحليل حجم القطاع، المنافسة، التنظيم والاتجاهات.

التقارير التي يعدها خبراء الصناعة توفر رؤى دقيقة تعكس الواقع وخصائص السوق.

جميع تقديرات السوق والمعلومات يتم إعدادها من قبل محللين بشريين، بينما يُستخدم الذكاء الاصطناعي فقط لدعم جمع البيانات وتحسين الكفاءة.
ما يميزنا عن الشركات الأخرى
حجم الفريق

في المتوسط، يقضي المحلل (وفريق الدعم) حوالي 1.5 إلى 2 شهر لبناء تقرير واحد.
يضمن هذا الجدول الزمني أننا قادرون على اعتماد منهجية بحث قوية تشمل النهج من الأعلى إلى الأسفل ومن الأسفل إلى الأعلى لتقدير أرقام السوق.
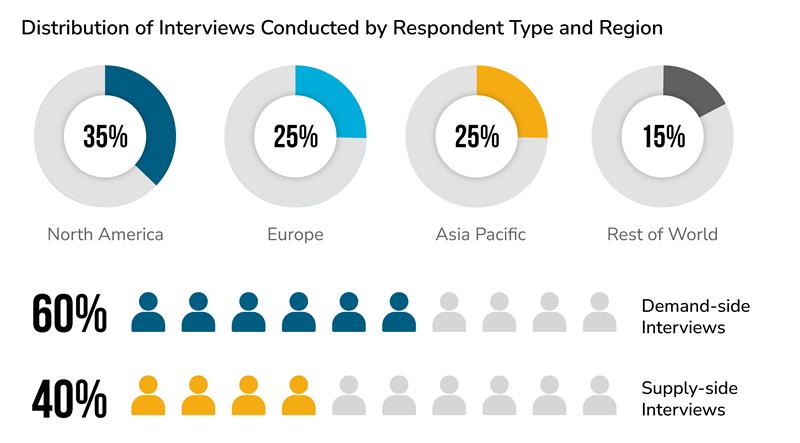
نحن لا نعتمد على مصادر البحث المكتبية فقط لبناء تقاريرنا. يتم دعم البيانات التي تم جمعها من مصادر مكتبية موثوقة برؤى يتم الحصول عليها من عدد كبير من المقابلات المدفوعة مع أصحاب المصلحة المعنيين (من جانب العرض ومن جانب الطلب).
إن بناء تقرير دقيق وموثوق من خلال المصادر الثانوية والأولية لا يمكن أن يتم إلا في إطار زمني أطول.
نستخدم تقنيات نمذجة السوق الخاصة بنا ونهجًا دقيقًا لتثليث البيانات للتحقق من صحة كل رقم منشور. نصل إلى تقديراتنا وتوقعاتنا النهائية من خلال مواءمة نتائج المقابلات الأولية والبيانات الثانوية والنماذج الداخلية. يضمن هذا الفلتر متعدد المستويات التحقق المتبادل من جميع نقاط البيانات لضمان الدقة والاتساق والترابط المنطقي. يطبق محللونا منهجيات تصاعدية وتنازلية، مستمدة من منظوري جانب الطلب والعرض.
نهج منهجية البحث

منهجية البحث - مصادر البيانات
البحث الأولي
مقابلات مع أصحاب المصلحة من الشركات الرئيسية في السوق (مقابلات من جانب العرض)
مقابلات مع أصحاب المصلحة من الصناعات النهائية (مقابلات من جانب الطلب)
مقابلات مع خبراء وقادة رأي رئيسيين لديهم خبرة واسعة في القطاع

البحث الثانوي
التقارير السنوية وعروض المستثمرين المنشورة من قبل الشركات الرئيسية في السوق
التقارير، المقالات، والاستبيانات الصادرة عن جمعيات ومنظمات مهنية ذات صلة
قواعد البيانات الحكومية والإيداعات التنظيمية
المجلات الأكاديمية، المقالات والأوراق البحثية
قواعد بيانات مدفوعة مثل Statista، Bloomberg، Factiva، D&B Hoovers وقواعد أخرى متخصصة مرتبطة بالسوق

التقارير ذات الصلة
